Coconut Grove vs. Coral Gables: What Your Money Buys in Each
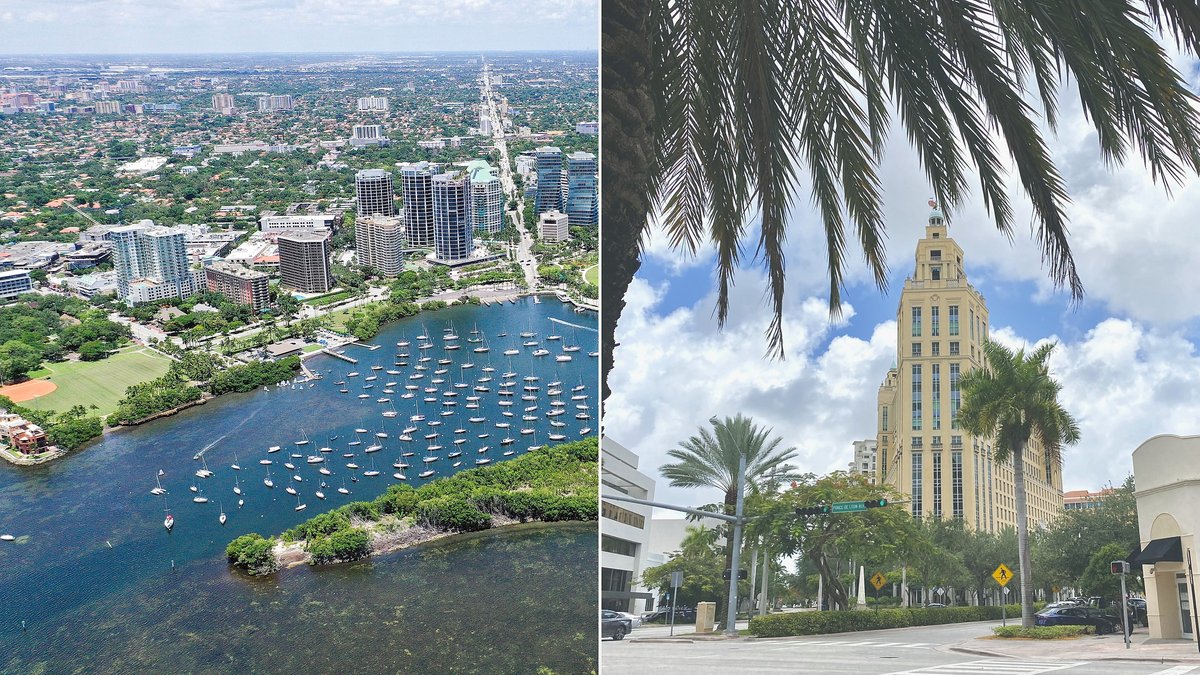
Photos: Anthony Quintano, Sharon Hahn Darlin, CC BY 2.0, cropped
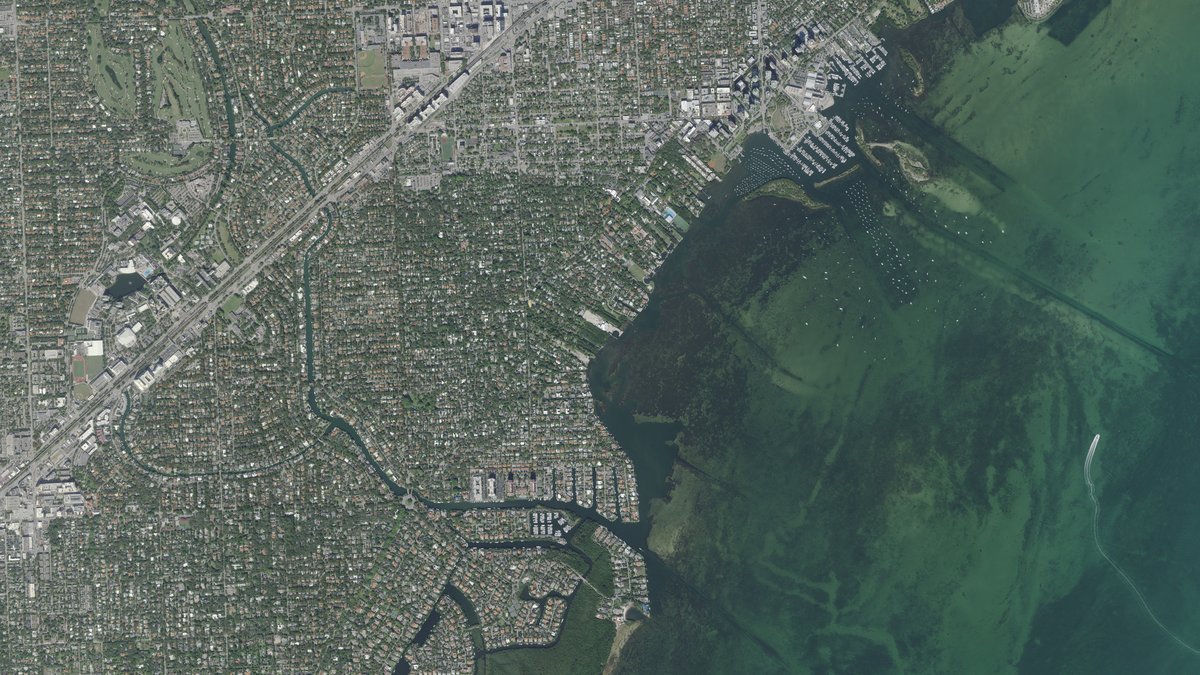
Coconut Grove and Coral Gables share nearly three miles of border and part of a zip code, and from the street the line between them is easy to miss. They are still very different places. The Grove is Miami's oldest neighborhood, a bayfront village that the City of Miami annexed in 1925. Coral Gables is the city George Merrick planned in that same decade, with its own city hall, its own design board and Mediterranean Revival streets that still follow his plan. Their price tags are further apart than the map suggests.
The Gables Is About Four Times the Size
Keep the scale in mind before comparing numbers. Coral Gables covers roughly four times the land of the Grove, about 13 square miles against 3.3 inside the Grove boundary I map, and holds three times as many single-family homes, close to 10,700 against 3,600. So when the Gables records 441 home sales in a year against 213 in the Grove, that reflects its size. Measured per home, the Grove turns over faster: 6 of every 100 single-family homes sold in the past year, against 4 in the Gables.
| Oct 2025 - Sep 2026, single-family | Coconut Grove | Coral Gables |
|---|---|---|
| Single-family homes | 3,570 | 10,687 |
| Homes sold | 213 | 441 |
| Median sold price | $2,800,000 | $2,175,000 |
| Median price per SF under air | $1,117 | $925 |
| Same, homes built before 2024 | $1,086 | $919 |
| Median house size, SF under air | 2,608 | 2,330 |
| Median lot | 7,394 SF | 10,000 SF |
| Share of sales under $1.5 million | 16% | 30% |
| Homes in a FEMA high-risk flood zone | 10% | 15% |
| Median ground elevation | 12.7 ft | 10.3 ft |
| Sales within a mile of Metrorail | 77% | 29% |
| Combined property tax rate (mills) | 19.9544 | 18.1518 |
Closed single-family sales from the SE Florida MLS via Compass, each placed by its mapped location rather than the neighborhood named in the listing (how I classify sales). Price per SF is sold price divided by SF under air. Home counts, flood zones and elevation cover every single-family parcel in the Miami-Dade Property Appraiser's records; elevation is ground level in feet above sea level (NAVD88) from USGS. Metrorail distance is a straight line to the nearest station. Analysis by Jorge Guanche, Compass.
Why the Grove Costs More
Part of the answer is new construction. About one in eight Grove sales last year was a house built since 2024, against one in thirty in the Gables, and those new Grove homes sold at a median $5.79 million. Take them out, though, and older Grove homes still sold for $167 more per square foot than older homes in the Gables.
The premium is sharpest on smaller houses. Under 3,000 square feet, older Grove homes sold for roughly $210 more a foot. Between 3,000 and 4,500 square feet, the two sold for essentially the same price per foot.
The two move at the same speed. Resale homes went under contract in a median 42 days in the Grove and 46 in the Gables, and in the third quarter both sold for 94% of their final asking price.
What $1.5 Million to $3 Million Buys
Between $1.5 million and $3 million, where the two markets overlap the most, you are buying much the same house in either place, a little over 2,000 square feet under air. The difference is the yard. The typical lot in that range is 7,000 square feet in the Grove and 9,950 in the Gables, so at that budget the Grove asks you to give up close to a third of the land in exchange for its location.
Below $1.5 million, the Gables is the easier place to get in. Three in ten Gables sales came in under that mark, against one in six in the Grove, where only 35 homes sold at that level all year. Three in four of those Gables sales were in 33134, the north end of the city. Across all of 33134, lots run close to the size of the Grove's, a median of 7,267 square feet, and homes sold for around $870 a foot. The Coral Gables guide breaks the city down zip by zip.
Above $5 million, the two sell different things. Nearly half of the Grove's top-end sales were new construction, with a typical build year of 2020. In the Gables, the typical top-end home was built in 1991 on half an acre, and most sat in the southern end of the city toward the bay.
Across both, the typical house was built in the 1950s, so plenty of buyers are pricing a renovation along with the purchase. My new construction vs. renovation breakdown covers what that costs per square foot.
Walk, Ride or Drive
The Grove is built for walking. Three in four Grove homes that sold were within a mile of a Metrorail station, and half were within a mile of CocoWalk, with Main Highway, Commodore Plaza and Peacock Park in the same blocks. The Coconut Grove guide goes section by section. The Gables spreads out. Fewer than one in three of its homes that sold were that close to rail, and fewer than one in four were within a mile of City Hall at the west end of Miracle Mile. The city's free trolley along Ponce de Leon Boulevard, which connects to the Douglas Road Metrorail station, closes some of that gap.
By car, Brickell is 5 miles from the typical Grove home and 6.5 from the typical Gables home. The airport runs the other way and is a little closer from the Gables.
Each has its own landmarks. The Grove has the bay at its door, with Dinner Key Marina, Peacock Park and the Barnacle, the Grove's oldest house. The Gables has the Biltmore, the Venetian Pool, Matheson Hammock and the University of Miami, whose effect on nearby home values has its own article.
The Grove Sits Higher, and That Changes the Insurance Math
Coconut Grove sits on the highest ground of the eight neighborhoods I cover, a typical 12.7 feet above sea level, and only 10% of its single-family homes are in a FEMA high-risk flood zone. In the Gables it is 15%, rising to 16% when FEMA's new maps take effect on Feb 19, 2027. The Grove's share stays at 10% under the new maps.
In both, the risk sits near the water. The Grove's exposure is its bayfront lowlands, where homes sit around 5 feet up and cost more to insure. A high-risk single-family flood policy in the Grove typically runs over $4,500 a year, against roughly $2,100 in the Gables.
In the Gables the risk climbs as you head south, from 1% of homes north of Miller Road (SW 56th Street) to two in three south of SW 88th Street. Away from the high-risk zones, a flood policy costs about $1,250 a year in either place. The full neighborhood-by-neighborhood picture is in my flood zones by neighborhood article, and my home insurance guide covers premiums and wind mitigation.
Rebuilding or Adding On
Both places protect their streetscapes, in different ways. In Coral Gables, the Board of Architects reviews new houses, additions, pools, paving and even roof tiles, usually with a preliminary and a final approval before a permit. Taking down a tree needs a permit, and if the replacement trees will not fit on the lot, the owner pays into the city's tree fund.
In the Grove, the City of Miami requires a permit to remove a tree, and most of the neighborhood sits in a neighborhood conservation district whose stated goals include protecting the tree canopy. A removal decision can be appealed to the city's Historic and Environmental Preservation Board and then to the City Commission, and those fights are on the rise: WLRN reported at least 14 tree-removal appeals in the City of Miami by early summer 2026, against one in all of 2025, and two of the four appeals on the commission's September agenda involved Grove properties. In either place, if you plan to rebuild or add on, build review time into the schedule.
Taxes and Schools
The combined property tax rate is 19.9544 mills in the Grove and 18.1518 in Coral Gables, according to the Miami-Dade Property Appraiser and my 2026-27 millage guide. That works out to $1,803 a year more in the Grove for every $1 million of taxable value. The property tax calculator runs it for a specific price.
On schools, the two overlap more than they differ. Coral Gables Senior High is the assigned high school for every single-family home in the Grove and nine in ten in the Gables, and Ponce de Leon Middle is the assigned middle school for nearly all of both. George Washington Carver Middle, rated (10/10) on GreatSchools, is a magnet that students from both apply into. Coconut Grove Elementary, also rated (10/10), is the assigned elementary for most of the Grove. Assignment depends on the address, so check it for the specific house.
So Which One?
The Grove makes sense if walking to dinner, riding the train and living close to the bay matter more to you than yard space, and you can accept a smaller lot and a higher tax rate to get them. The Gables makes sense if you want more land for your money, a wider choice under $1.5 million and streets the city keeps consistent, and you are comfortable with design review on anything you change.
Neighborhood medians blend very different houses, so they only get you so far. When I value a home in either place, I start by walking the house in person, then compare it against sales in its own section: an older Grove home against older Grove sales, a north Gables home against the north Gables. Send me the two addresses you are deciding between and I will pull the sales behind each one, along with the flood zone and what the city requires if you plan to build. Call or text me at 786-223-1117.
Sources
SE Florida MLS via Compass, Property Analysis exports pulled October 4, 2026: closed single-family sales Oct 2025 - Sep 2026, placed by mapped location. Analysis by Jorge Guanche.
Miami-Dade Property Appraiser parcel layer
Miami-Dade Property Appraiser, 2026 and 2025 Proposed Millage Comparison, August 24, 2026
FEMA National Flood Hazard Layer and Pending NFHL (effective February 19, 2027)
FEMA OpenFEMA NFIP Redacted Policies v3, single-family policies in force September 1, 2026
U.S. Census Bureau, TIGERweb, Coral Gables city land area
Miami-Dade County GIS, Metrorail stations; OpenStreetMap road network via OSRM
Miami-Dade County Public Schools attendance boundaries (Miami-Dade County GIS); GreatSchools, checked October 12, 2026
City of Coral Gables: Board of Architects, tree permits and trolley (link) (link)
City of Miami, Tree Information and Resources: ; Neighborhood Conservation Districts (link)
WLRN, "Miami's tree permit battles reach city commission," September 8, 2026
Florida historical marker "Coconut Grove": ; NBC Miami, Coral Gables centennial, April 29, 2025
Jorge Guanche, 2026-27 Combined Millage Guide and Q3 2026 Market Report