
MARKET INTELLIGENCE
Miami Real Estate Market: The Eight Neighborhoods I Cover
Single-family market data for the eight southwest Miami-Dade neighborhoods I cover, refreshed every quarter from MLS closings classified by each property's actual location rather than its MLS label.
Where the market stands now
These are the Q3 2026 figures, the most recent full quarter: single-family closings from July through September, measured against the same months a year earlier. Across all eight neighborhoods the median was $1,650,000, up 10.0%, on 438 closings, and homes went under contract in a median 42 days. Supply stood at 4.2 months on October 4.
| Neighborhood | Median Sold | YoY | Median $/SF | $/SF YoY | Days to Contract |
|---|---|---|---|---|---|
| Coconut Grove | $2,800,000 | +21.7% | $1,245 | +30.4% | 45 |
| Kendall | $1,200,000 | +13.5% | $496 | +11.1% | 41.5 |
| Pinecrest | $2,900,000 | +14.4% | $832 | +9.9% | 43 |
| Coral Gables | $2,102,500 | +12.1% | $923 | +3.0% | 40 |
| South Miami | $1,391,500 | +10.9% | $738 | +4.2% | 43 |
| Palmetto Bay | $1,200,000 | +9.4% | $502 | +2.9% | 41 |
| Glenvar Heights | $1,810,000 | +4.6% | $823 | +18.3% | 40 |
| High Pines + Ponce-Davis | n/m | n/m | n/m |
High Pines + Ponce-Davis closed 3 sales in the quarter, too few for a meaningful median; over the trailing twelve months, High Pines had a $3,200,000 median on 21 sales and Ponce-Davis $8,075,000 on 24. Glenvar Heights (17 sales) and South Miami (22) are small samples. Source: SE Florida MLS via Compass, Q3 2026 vs Q3 2025, single-family homes classified by mapped location. Full analysis in the Q3 2026 report.
Median sold price by quarter
The same eight neighborhoods across the three quarters reported so far in 2026. Each figure is the median single-family sold price published in that quarter's report.
| Neighborhood | Q1 2026 | Q2 2026 | Q3 2026 |
|---|---|---|---|
| Coconut Grove | $3,000,000 | $2,750,000 | $2,800,000 |
| Coral Gables | $2,000,000 | $2,550,000 | $2,102,500 |
| Glenvar Heights | $1,700,000 | $2,394,990* | $1,810,000 |
| High Pines + Ponce-Davis | not reported | $7,250,000 | n/m |
| Kendall | $1,010,000 | $1,092,500 | $1,200,000 |
| Palmetto Bay | $1,050,000 | $1,200,000 | $1,200,000 |
| Pinecrest | $2,750,000 | $2,560,000 | $2,900,000 |
| South Miami | $1,370,000 | $1,020,000 | $1,391,500 |
*Glenvar Heights' Q2 median was lifted by six new-construction closings. The Q1 report did not break out High Pines + Ponce-Davis; it closed 15 sales in Q2 and 3 in Q3, too few for a meaningful median. A quarterly median in a small neighborhood moves with the mix of homes that sold: Glenvar Heights closed 20, 27 and 17 sales in the three quarters, and South Miami 35, 32 and 22. Source: SE Florida MLS via Compass, single-family homes classified by mapped location, from the Q1, Q2 and Q3 2026 reports.
Each neighborhood in Q3 2026
Coconut Grove closed 57 single-family sales at a $2,800,000 median, up 21.7% from Q3 2025. Price per square foot rose 30.4% to $1,245, and homes went under contract in a median 45 days.
Coral Gables closed 96 sales at a $2,102,500 median, up 12.1%. Price per square foot rose 3.0% to $923, with a median 40 days to contract.
Glenvar Heights closed 17 sales, a small sample, at a $1,810,000 median, up 4.6%. Price per square foot rose 18.3% to $823, with a median 40 days to contract.
High Pines + Ponce-Davis closed 3 sales in the quarter, too few for a meaningful median. Over the trailing twelve months, High Pines had a $3,200,000 median on 21 sales and Ponce-Davis $8,075,000 on 24.
Kendall closed 93 sales at a $1,200,000 median, up 13.5%. Price per square foot rose 11.1% to $496, with a median 41.5 days to contract.
Palmetto Bay closed 87 sales at a $1,200,000 median, up 9.4%. Price per square foot rose 2.9% to $502, with a median 41 days to contract.
Pinecrest closed 63 sales, the same count as Q3 2025, at a $2,900,000 median, up 14.4%. Price per square foot rose 9.9% to $832, with a median 43 days to contract.
South Miami closed 22 sales, a small sample, at a $1,391,500 median, up 10.9%. Price per square foot rose 4.2% to $738, with a median 43 days to contract.
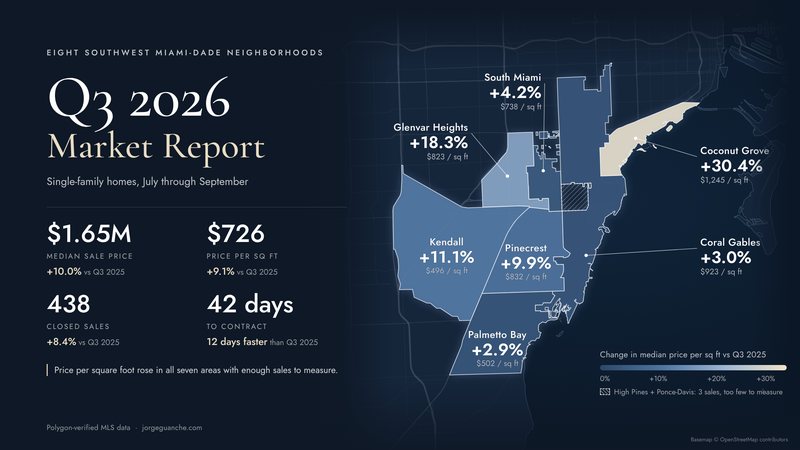
Q3 2026: Southwest Miami-Dade Single-Family Report
The median rose 10.0% to $1,650,000 across the eight neighborhoods I cover, price per square foot climbed in all seven measurable areas, and supply edged up to 4.2 months. Neighborhood-level data inside.
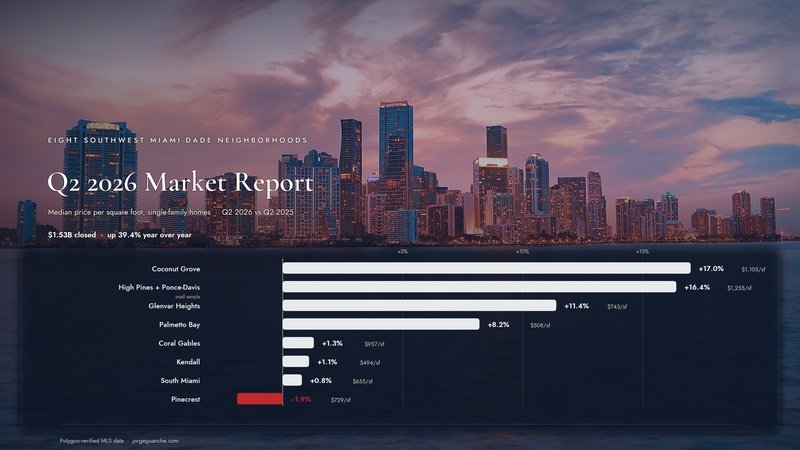
Q2 2026: Southwest Miami-Dade Single-Family Report
Dollar volume jumped 39.4% across the eight neighborhoods I cover, price per square foot rose in seven of them, and Glenvar Heights posted the tightest supply of the group. Neighborhood-level data inside.
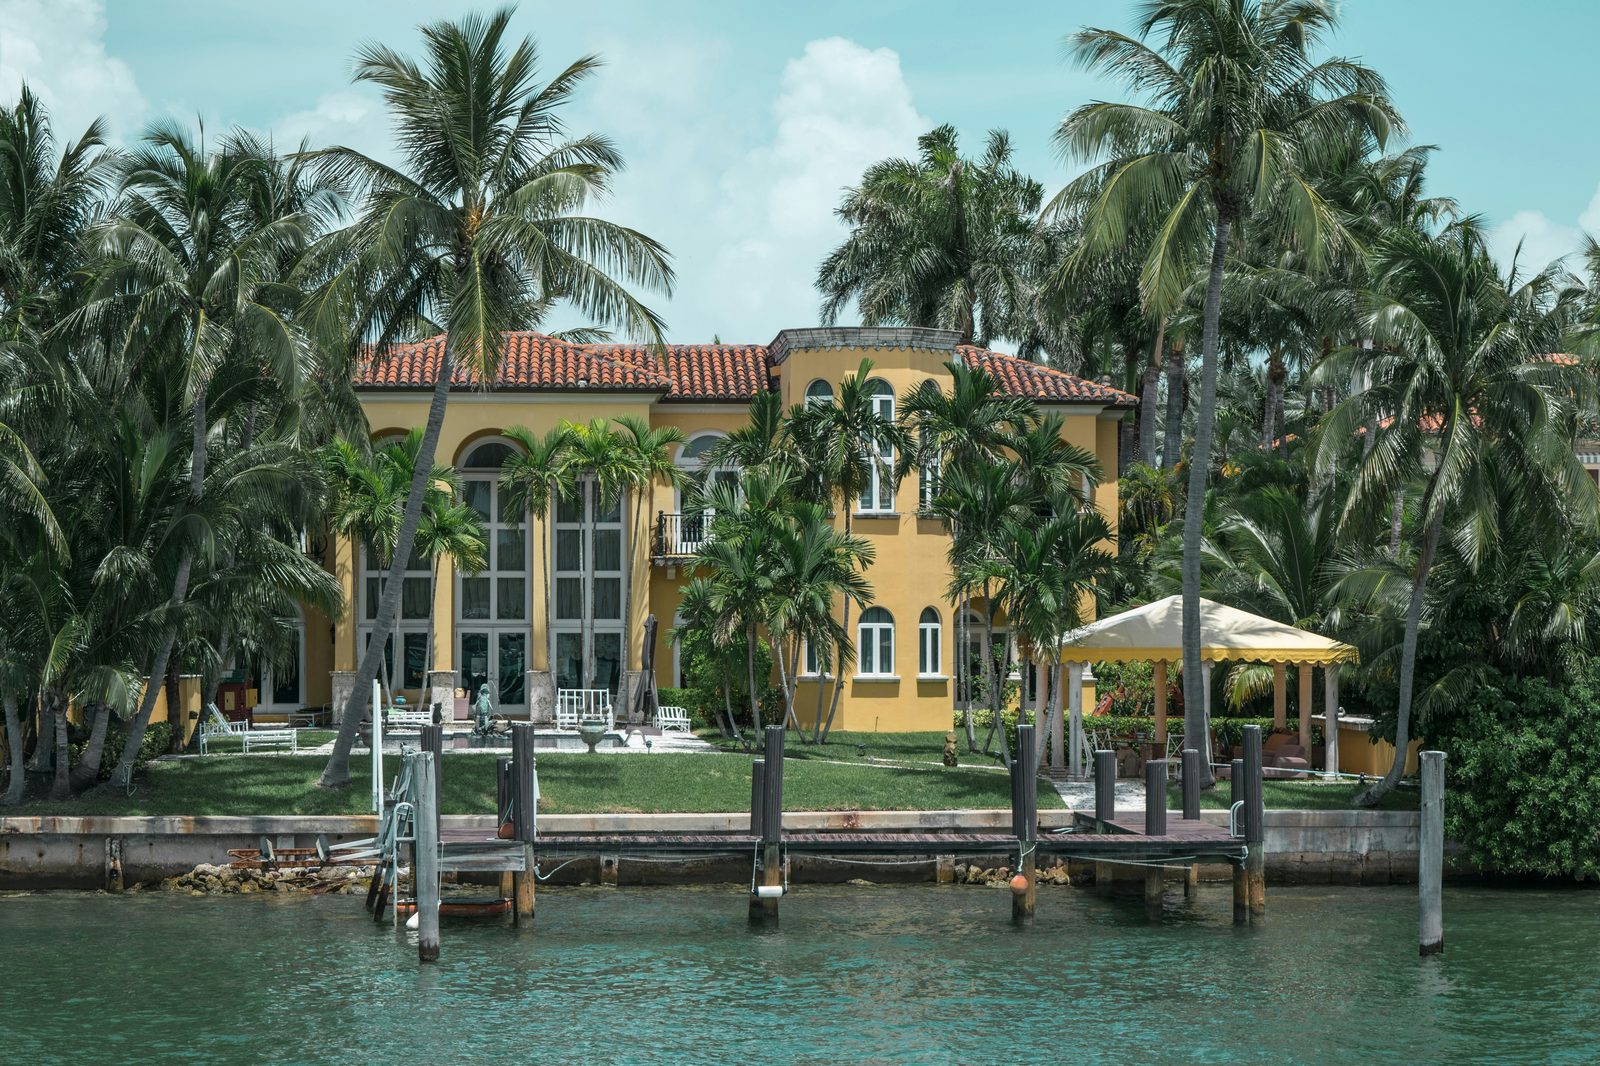
Q1 2026: Southwest Miami-Dade Single-Family Report
Miami-Dade's single-family home market is stabilizing. County-wide dollar volume jumped 15.6%, luxury sales above $1M surged 21%, and insurance costs are finally easing. Neighborhood-level data for all eight communities I serve.
Common Questions
Frequently Asked Questions
Across the eight neighborhoods Jorge Guanche covers, the median single-family sold price was $1,650,000 in Q3 2026 (July through September), up 10.0% from Q3 2025, on 438 closings. By neighborhood, the medians ran from $1,200,000 in Kendall and Palmetto Bay to $2,900,000 in Pinecrest.
In Q3 2026, homes that sold went under contract in a median 42 days across the eight neighborhoods. In the seven neighborhoods with enough sales to measure, the median ran from 40 to 45 days. Supply stood at 4.2 months on October 4, 2026.
The numbers are updated every quarter. Jorge publishes a report shortly after each quarter closes, and the tables on this page move to the new quarter at the same time. The Q3 2026 report was published on October 4, 2026.
n/m means not meaningful. When a neighborhood closes only a handful of sales in a quarter, the median mostly reflects which homes happened to sell, so Jorge does not publish one. High Pines + Ponce-Davis closed 3 sales in Q3 2026.
Want a Custom Market Analysis?
Get a personalized, data-driven report for your specific neighborhood, property type, and investment goals.