Compass Real Estate · Miami
Miami Neighborhood Guide
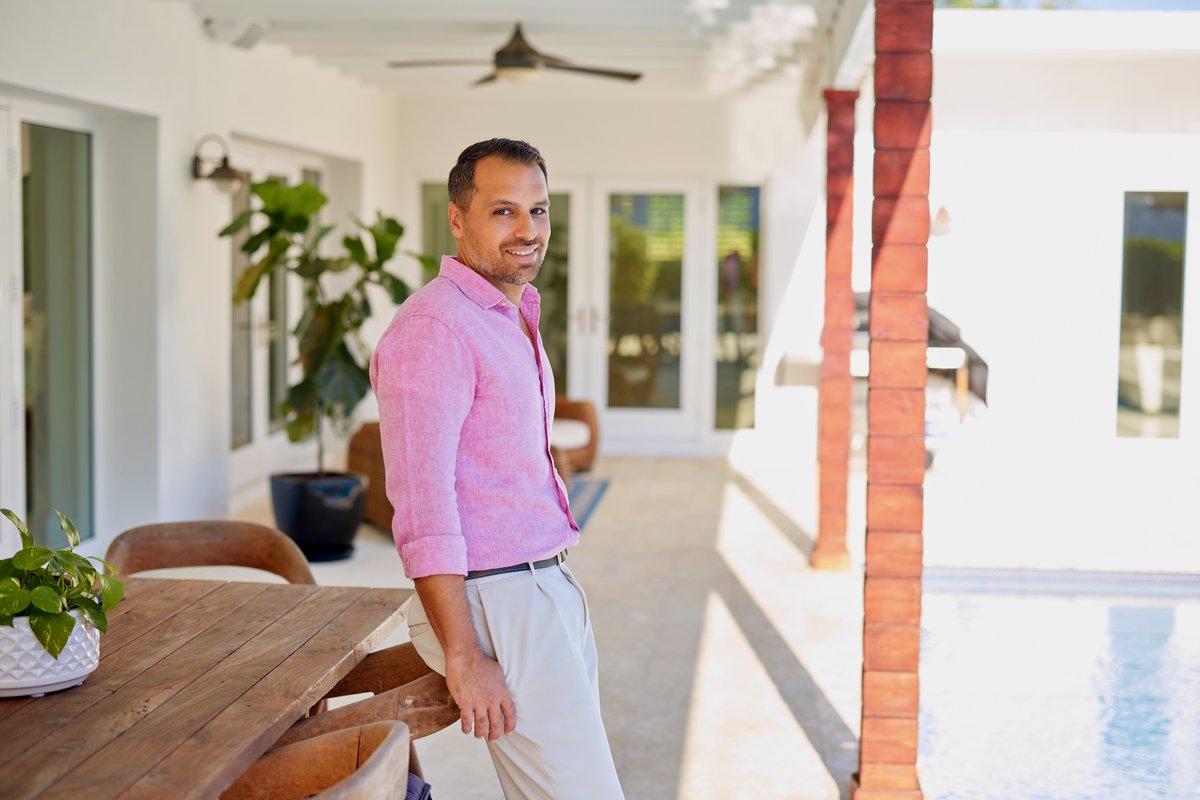
Your Market Analyst
Local Knowledge. Data-Driven Insight.
Most neighborhood guides give you a paragraph of lifestyle copy and a median price pulled from wherever was convenient. The page you are on now works differently. Every sale figure here (median price, its change, days to contract, closed sales) comes from the same source (MLS closed single-family home sales), covers the same quarter (Q3 2026, July through September, against the same months of 2025), and was cleaned and verified the same way. Lot sizes are medians across the trailing twelve months of closed sales, because one quarter is too few parcels to type a neighborhood, and where the notes below cite a twelve-month count they say so. High Pines + Ponce-Davis gets the same treatment for price this quarter, because its 3 closings are too few for a median. That is what makes a real comparison across neighborhoods possible.
I cover eight Miami-Dade submarkets: Glenvar Heights, South Miami, High Pines + Ponce-Davis, Coral Gables, Coconut Grove, Pinecrest, Palmetto Bay, and Kendall. Third-quarter medians run from $2.9 million in Pinecrest down to $1.2 million in Kendall and Palmetto Bay, and High Pines + Ponce-Davis sits above them all at $5.5 million over the past twelve months. Each neighborhood has a full city guide with deeper data, school information, lifestyle context, and two decades of working these streets. Use the comparison table below to get oriented, then open the individual guides for the detail.
Buying or selling in any of these eight markets? Start with the data below. Then call me when you are ready to get specific.
Neighborhood Map
My Primary Markets
Interactive map showing all eight Miami-Dade neighborhoods covered in this guide. Click any neighborhood to open its guide.
Market Data
How the Numbers Compare
Click any neighborhood name to read the full city guide.
| Neighborhood | Median Price | YOY | Days to Contract | Lot Size | Sales | Top School |
|---|---|---|---|---|---|---|
| Pinecrest | $2,900,000 | +14.4% | 43 days | 24,534 SF | 63 | Palmetto Elem (10/10) |
| Coconut Grove | $2,800,000 | +21.7% | 45 days | 7,500 SF | 57 | Carver Elem (10/10) |
| Coral Gables | $2,102,500 | +12.1% | 40 days | 10,000 SF | 96 | CG Prep Academy (10/10) |
| Glenvar Heights* | $1,810,000 | +4.6% | 40 days | 16,438 SF | 17 | St. Thomas, Gulliver Prep |
| South Miami | $1,391,500 | +10.9% | 43 days | 10,080 SF | 22 | Sunset Elem (10/10) |
| Kendall | $1,200,000 | +13.5% | 41.5 days | 15,006 SF | 93 | Kenwood K-8 (8/10); verify by address |
| Palmetto Bay | $1,200,000 | +9.4% | 41 days | 15,670 SF | 87 | Howard Drive K-8 (9/10) |
| High Pines + Ponce-Davis† | n/m (3 sales) | n/m | n/m | 0.27 / 0.85 AC | 3 | Sunset Elem (10/10) |
*Glenvar Heights figures include new construction.
†High Pines + Ponce-Davis combines two sub-areas that behave differently, and its 3 closings in Q3 2026 (2 in High Pines, 1 in Ponce-Davis) are too few to measure. Over the trailing twelve months (October 2025 to September 2026), High Pines had a $3,200,000 median on 21 sales and Ponce-Davis $8,075,000 on 24, for a combined $5,500,000 on 45. Lot size shows the two medians separately: 0.27 AC across High Pines, 0.85 AC across Ponce-Davis. Individual Ponce-Davis estate parcels commonly run from roughly half an acre to 2+ acres, so the 0.85 is a midpoint, not a ceiling. See the High Pines + Ponce-Davis guide for the full sub-area breakdown.
All figures: closed single-family home sales, Q3 2026 (Jul - Sep) vs Q3 2025, classified by mapped location, via MLS. Days to contract runs from listing to accepted contract. Glenvar Heights (17 sales) and South Miami (22) are small samples. Last updated: October 2026. Full quarter analysis in the Q3 2026 Southwest Miami-Dade Market Report.
The Neighborhoods
Eight Markets. Eight Stories.
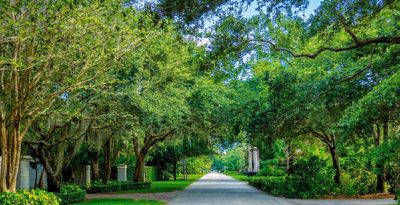
Established, residential, generous lots at a lower per-foot
Glenvar Heights
Almost entirely residential, with no real commercial district or nightlife scene. The draw is generous lots and strong private and public schools. Jorge lives here and works the blocks every week.
Read the Full Guide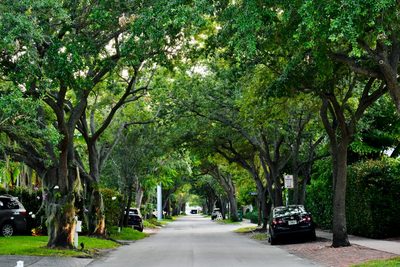
Small-town feel around a real downtown
South Miami
South Miami has a real downtown with a distinct identity, and its typical lot is about a quarter acre. The Q3 2026 median rose 10.9% to $1,391,500 and homes went under contract in a median 43 days, though 22 sales is a small sample.
Read the Full Guide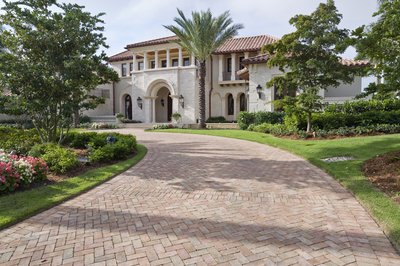
The unincorporated mile between Coral Gables and Pinecrest
High Pines + Ponce-Davis
A square mile of unincorporated Miami-Dade inside zip 33143, split by School House Road into two distinct price tiers. Ponce-Davis sits on estate-scale lots east of the line and High Pines on quarter-acre lots west of it. Only 3 homes closed here in Q3 2026, so the twelve months through September tell the story, with a $3,200,000 median in High Pines on 21 sales and $8,075,000 in Ponce-Davis on 24.
Read the Full Guide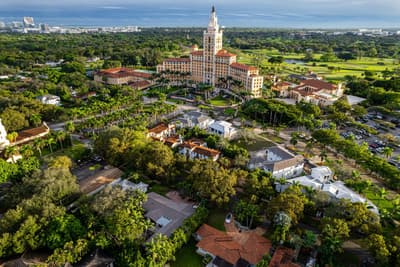
The City Beautiful. Highest transaction volume, steady appreciation
Coral Gables
Mediterranean architecture, tree-lined boulevards, and a downtown with restaurants and retail. Its 441 single-family sales over the twelve months through September 2026 are the most of the eight neighborhoods, and its 96 closings in Q3 2026 came at a $2,102,500 median, up 12.1%.
Read the Full Guide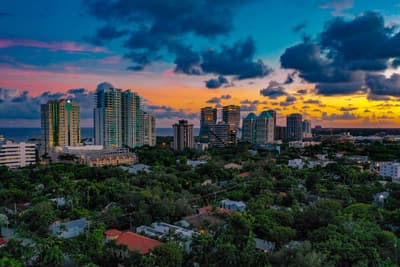
Walkable village center, banyan canopy, fastest-appreciating market
Coconut Grove
Walkable streets, banyan canopy, and the only true village-center dining and shopping scene in this group. The Q3 2026 median rose 21.7% to $2,800,000 and price per square foot rose 30.4% to $1,245, the highest of the eight, with eight new-construction sales in the mix against three a year earlier.
Read the Full Guide
Half-acre estates and top-rated public schools
Pinecrest
Half-acre lots, mature tree canopy, and public schools that are among the highest-rated in Miami-Dade. Its $2,900,000 Q3 2026 median was the highest of the seven measurable areas, and homes went under contract in a median 43 days against 92 a year earlier. At 5.4 months of supply, Pinecrest still has the most listings to choose from relative to its sales pace.
Read the Full Guide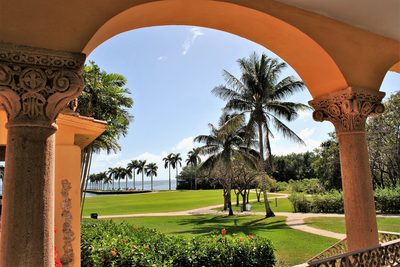
Generous lots and the tightest supply in this group
Palmetto Bay
Strong public schools, generous lots, parks, bike paths and a village center. It closed 87 single-family sales in Q3 2026 at a $1,200,000 median, up 9.4%, and its 2.8 months of supply is the tightest of the eight, which favors sellers.
Read the Full Guide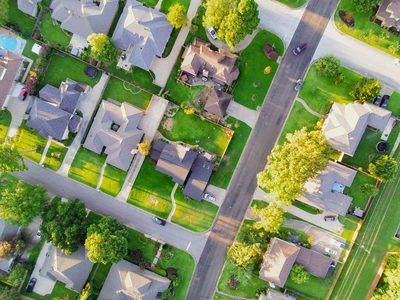
A million-dollar SFH market on third-acre lots
Kendall
Suburban space, proximity to Baptist Hospital and UM, and strong school options. Kendall closed 93 sales in Q3 2026 at a $1,200,000 median, up 13.5%, with homes going under contract in a median 41.5 days and 3.3 months of supply.
Read the Full GuideCommon Questions
Frequently Asked Questions
Of the eight neighborhoods covered on this site, High Pines + Ponce-Davis is the most expensive, with a combined median sale price of $5,500,000 on 45 sales over the twelve months from October 2025 through September 2026. It closed only 3 homes in Q3 2026, too few for a quarterly median, and the estate-scale Ponce-Davis half ($8,075,000 median on 24 sales) does the lifting. Among the seven areas with enough Q3 2026 sales to measure, Pinecrest had the highest median at $2,900,000, followed by Coconut Grove at $2,800,000 and Coral Gables at $2,102,500. These figures are for single-family homes only. All-residential numbers (which include condos and townhomes) will be significantly lower, especially in Coconut Grove and Kendall where multi-family housing makes up a large share of the inventory.
Coconut Grove had the strongest price growth in Q3 2026. Its median sale price rose 21.7% to $2,800,000, and its price per square foot rose 30.4% to $1,245, the highest of the eight areas. Part of that move reflects which homes sold, since eight of its 57 sales were new construction (three a year earlier) and the top sale closed at $22.5 million. Behind it, the median rose 14.4% in Pinecrest, 13.5% in Kendall, 12.1% in Coral Gables, 10.9% in South Miami, 9.4% in Palmetto Bay and 4.6% in Glenvar Heights, where price per square foot still rose 18.3%. South Miami (22 sales) and Glenvar Heights (17) are small samples, so read their changes as a direction. High Pines + Ponce-Davis had 3 sales, too few to compare. All figures are MLS closed single-family sales, Q3 2026 versus Q3 2025.
Most real estate platforms report all-residential data, which puts condos, townhomes, and single-family homes into a single median figure, and this page counts single-family homes only. In neighborhoods with significant condo inventory (like Coconut Grove or Kendall), that mix pulls the median down considerably. For example, Kendall's single-family median was $1,200,000 in Q3 2026; a portal median for Kendall that mixes in its many condos and townhomes will land well below that.
Homes across the eight neighborhoods went under contract in a median 42 days in Q3 2026, against 54 days a year earlier. Coral Gables and Glenvar Heights were the fastest at 40 days to contract, followed by Palmetto Bay at 41, Kendall at 41.5, Pinecrest and South Miami at 43, and Coconut Grove at 45. Pinecrest changed the most, down from 92 days a year earlier. High Pines + Ponce-Davis had 3 sales, too few for a median. Days to contract is the median time from listing to accepted contract.
Ponce-Davis (the eastern half of the High Pines + Ponce-Davis submarket) has the largest typical lot at 0.85 acres (about 37,000 SF), reflecting its estate-scale character. Pinecrest follows at 24,534 SF (just over half an acre). Glenvar Heights, Palmetto Bay, and Kendall all offer lots in the 15,000-16,500 SF range (roughly a third of an acre). South Miami and Coral Gables are around 10,000 SF (quarter acre). The High Pines half sits at 0.27 acres (just under 12,000 SF). Coconut Grove has the smallest lots at 7,500 SF, reflecting its walkable, urban-village density.
I have worked these eight neighborhoods for over 20 years, with $200M+ in career sales and over 100 five-star reviews. I analyze the MLS sales used on this page and check their locations against neighborhood boundaries. For a detailed market analysis specific to your street, price range, and timeline in any of these areas, call 786-223-1117 or schedule a consultation through this site.
Ready to Get Specific?
These eight neighborhoods recorded 1,798 single-family home sales over the twelve months through September 2026. Comparing areas or already know where you want to be? I can put this data to work for your specific situation.