Does It Flood? Flood Zones, Flood History and Flood Insurance in Southwest Miami
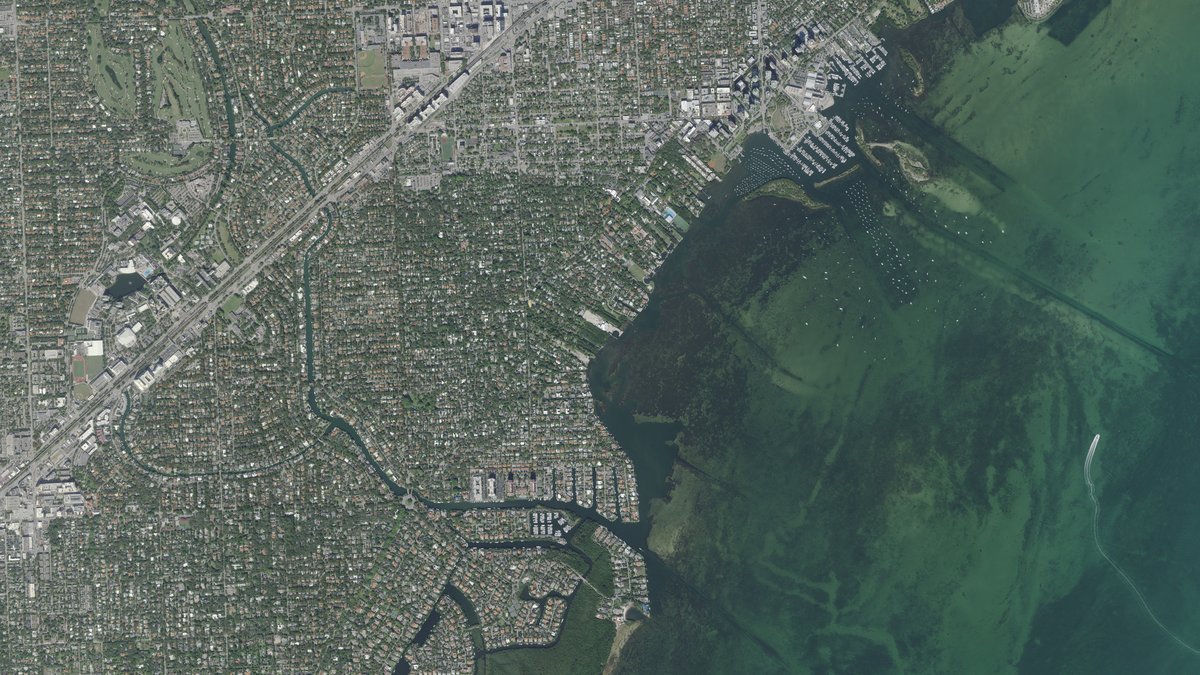
Whether a house floods depends more on the block than on the neighborhood, but the neighborhood still tells you a lot. Below are the flood zones in each of the eight areas, how high each one sits, where FEMA's claim records show water has come in since 1978, when a policy is required and what owners here pay for one.
The Flood Zones, in Plain English
FEMA maps every property into a flood zone. The letters tell your lender whether flood insurance is mandatory and tell the building department what rules apply if you rebuild. They do not set your premium on their own, because flood insurance is now priced house by house.
| Zone | What it means | Required with a mortgage? | Typical policy here |
|---|---|---|---|
| VE | Coastal high-risk area exposed to waves | Yes | $4,965 |
| AE | High-risk: at least a 1% chance of flooding in any year, with a mapped flood height | Yes | $2,613 |
| AH | High-risk: shallow ponding, usually 1 to 3 feet deep | Yes | $985 |
| Shaded X | Moderate risk: between the 1% and 0.2% annual flood lines | No federal requirement | $1,260 (both X zones) |
| X | Minimal risk | No federal requirement | $1,260 (both X zones) |
Typical policy: median annual cost of NFIP policies in force on single-family primary residences in the eight neighborhoods, Sep 1, 2026, including fees. Source: FEMA OpenFEMA policy data.
VE shows up mainly on the bayfront edge of Coconut Grove and Coral Gables. It is the most expensive zone to insure, and new construction or a major renovation there has to meet the strictest building rules, with the house raised on pilings or columns above the mapped flood height.
AE is the zone most people mean when they say "flood zone." A federally backed mortgage requires flood insurance, and the flood height on the map is the line that matters. If the home's lowest floor sits above it, the policy tends to cost less. In any of the high-risk zones (VE, AE and AH), a renovation or repair costing 50% or more of the building's market value triggers the flood rules for the whole house, which can mean raising it. That is worth knowing before you buy a house to renovate.
AH is also high-risk on paper and carries the same mortgage requirement, but the expected water is shallow ponding after heavy rain. Most AH homes here are in Kendall, South Miami and Glenvar Heights, and in all three the typical AH policy costs less than the typical Zone X policy. In Pinecrest the order flips, so do not read the zone letter as a price.
Zone X, shaded or not, carries no federal insurance requirement. It is still not a no-flood zone. One in three flood insurance claims nationally comes from low- and moderate-risk zones, according to FEMA.
Neighborhood by Neighborhood
| Neighborhood | Most homes are in | Homes in a high-risk zone today | On FEMA's new maps (Feb 19, 2027) | Typical ground elevation | Typical policy, high-risk homes | Flood claims since 1978 |
|---|---|---|---|---|---|---|
| Coconut Grove | Zone X | 10% | 10% | 12.7 ft | $4,562 | 965 |
| Coral Gables | Zone X | 15% | 16% | 10.3 ft | $2,132 | 1,267 |
| Glenvar Heights | Zone X | 9% | 16% | 10.3 ft | $921 | 120 |
| High Pines + Ponce-Davis | Zone X | 3% | 34% | 9.5 ft | too few policies to say | 88 |
| Pinecrest | Zone X | 42% | 7% | 9.3 ft | $2,670 | 488 |
| Palmetto Bay | Zone AE | 60% | 8% | 9.1 ft | $2,618 | 1,058 |
| South Miami | Zone X | 25% | 43% | 9.0 ft | $1,080 | 163 |
| Kendall | Zone X | 24% | 17% | 8.6 ft | $984 | 1,434 |
Shares rounded. Single-family homes (Property Appraiser single-family land use, cluster homes excluded) from Miami-Dade Property Appraiser parcels checked against FEMA's current and new flood maps, placed in the same neighborhood boundaries as my Q3 2026 market report. Elevation is the median ground height of those homes in feet (NAVD88, the survey baseline flood maps use), from USGS 3DEP lidar, most of it flown in 2024. Policies and claims are FEMA's NFIP records for single-family homes, matched to each neighborhood by census block group; claims include those closed without payment. Typical Zone X policies run $1,072 to $1,264 across the eight.
Coconut Grove sits on the highest ground of the eight, along the limestone ridge that runs through the Grove. The exposure is the bayfront lowlands, where homes sit around 5 feet and carry AE and VE zones, and high-risk policies there run over $4,500. Hurricane Andrew in 1992 and Hurricane Irma in 2017 account for most of its claims, both from bay surge.
Coral Gables is mostly Zone X north of SW 56th Street (Miller Road), where 1% of homes are in a high-risk zone. South of SW 88th Street, along the bay, two in three are. Andrew produced more than half of the city's claims.
Glenvar Heights has one of the two lightest flood histories of the eight for its size, along with South Miami, with 120 claims since 1978, and it ties Coral Gables for the second-highest ground. Its high-risk homes today are almost all in shallow AH zones. On the new maps, roughly 180 homes move into a high-risk zone. The biggest event was the October 2000 rainstorm.
High Pines + Ponce-Davis has 3% of its homes in a high-risk zone today, but High Pines moves to 64% on the new maps, in an AE zone where the mapped flood height sits less than a foot above the typical lot. Since 2018 it has had more flood claims than any other neighborhood I cover, 22, with 20 of them from the June 2022 rainstorm known as Potential Tropical Cyclone One, and all of them on Zone X policies.
Pinecrest has 42% of its homes in a high-risk zone today, nearly all AE, and only 7% on the new maps. Half of its claims came from Andrew and the heavy rain of Hurricane Katrina in 2005.
Palmetto Bay has the most homes in a high-risk zone today, 60%, and one of the smallest shares on the new maps, 8%. Most of the homes leaving move into shaded Zone X, which is still moderate risk. Andrew is its biggest event, with 419 claims, followed by Katrina with 283.
South Miami sees the biggest increase after High Pines + Ponce-Davis, from 25% in shallow AH zones today to 43% in AE on the new maps. Its claims history is light, 163 claims spread mainly across Hurricane Irene in 1999, Hurricane Andrew and the October 2000 storm.
Kendall sits lowest of the eight and has the most claims, 1,434, largely from rain rather than the bay. Hurricane Irene in 1999 produced the most, followed by Katrina in 2005. Its high-risk homes are almost all in shallow AH zones, and its typical high-risk policy runs under $1,000.
Where It Has Flooded
FEMA's claim records for these eight neighborhoods go back to 1978 and show two kinds of flooding. Along the bay, it is storm surge. Inland, it is rain that the ground and drains cannot take fast enough.
| Event | Flood claims in the eight areas | What happened |
|---|---|---|
| Hurricane Andrew, Aug 1992 | 1,826 | Bay surge, with the most claims in Coral Gables, Palmetto Bay and the Grove |
| Hurricane Katrina, Aug 2005 | 791 | Heavy rain in southern Miami-Dade, led by Palmetto Bay, Kendall and Pinecrest |
| Hurricane Irene, Oct 1999 | 751 | 13.5 inches of rain at South Miami, part of 6 to 17 inches across southeast Florida; Kendall hit hardest |
| Hurricane Irma, Sep 2017 | 593 | Bay flooding more than 6 feet deep in isolated spots of Coconut Grove |
| October 2000 storm | 282 | 12 to 18 inches of rain in 24 hours in southwest Miami-Dade |
| Hurricane Wilma, Oct 2005 | 173 | The most claims in Coconut Grove; two in three were coded as rain flooding |
| Potential Tropical Cyclone One, Jun 2022 | 28 | More than 12 inches of rain near Coral Gables; most claims in High Pines + Ponce-Davis |
The last several years have been quiet, with 82 flood claims across all eight neighborhoods since 2018. Half of them were on Zone X homes, though roughly half of those came from one storm in High Pines + Ponce-Davis in June 2022. Either way, Zone X homes here do file flood claims.
King tides are a separate, seasonal nuisance on the lowest bayfront streets. The City of Miami's 2026 calendar lists peak tide days Oct 24-30, followed by king tides Nov 6-9 and Nov 23-26. They flood streets and seawalls, and they do not show up as a pattern in the claim records.
Do You Need Flood Insurance?
Two things can make it mandatory.
Your lender requires it if the house is in VE, AE or AH and the loan is federally backed or from a regulated lender, which covers nearly every mortgage. A lender can also require it in Zone X.
Citizens requires it if Citizens writes your homeowners policy. For new policies and renewals on or after Jan 1, 2027, most of its wind-inclusive homeowners policies must carry flood coverage, regardless of zone or home value. High-risk homes already need it, and the requirement has been phasing in by dwelling value since 2024. Condo unit-owner policies, tenant policies and policies without wind coverage are exempt.
Everyone else is choosing. My view has not changed from my home insurance guide: do not read a Zone X designation as permission to skip coverage. In Zone X here, the typical policy works out to $105 a month, and 42 of the 82 flood claims in these neighborhoods since 2018 were on Zone X policies.
If you are selling, Florida now requires a flood disclosure at or before contract. It asks about past flooding, flood claims and flood aid during your ownership. It does not ask about the zone.
What a Flood Policy Costs Here
Flood insurance is priced house by house, so no neighborhood number is a quote for a specific home. FEMA does publish what policyholders pay. For single-family homes in the eight neighborhoods, the typical Zone X bill as of September 2026 was $1,260 a year, with the middle half of bills between $1,080 and $1,270. AH ran $985 and VE $4,965. AE, at $2,613, depends most on where the house sits: $2,624 in Palmetto Bay, $2,732 in Pinecrest and $4,454 in the Grove.
Of those policies, 94% carry the federal maximum of $250,000 on the house, and 6 in 10 also carry the $100,000 maximum on contents.
A buyer starting a new policy should budget above those medians. Close to 6 in 10 current bills are still on a glide path toward their full price, rising up to 18% a year, and new policies written in the past year ran a median $1,443 in Zone X, $1,265 in AH and $2,806 in AE.
Five things move the price on a specific house: its elevation, especially the height of the lowest floor; the distance to the bay or a canal; the construction and foundation; what it would cost to rebuild; and the community's discount. Unincorporated Miami-Dade, which includes Kendall, Glenvar Heights and High Pines + Ponce-Davis, holds the best rating in FEMA's discount program among these communities, worth 35% on eligible policies. Coral Gables and Palmetto Bay get 25%, the City of Miami and South Miami 20%, and Pinecrest 15%.
A new NFIP policy takes 30 days to start, unless you buy it with a mortgage at closing. Private flood carriers also write here, and lenders and Citizens accept them, so quote both.
FEMA's New Maps, Feb 19, 2027
FEMA's updated flood maps for Miami-Dade take effect Feb 19, 2027, replacing maps in force since 2009. Across the eight neighborhoods, the share of single-family homes in a high-risk zone falls from 27% to 16%. Palmetto Bay and Pinecrest see the biggest drops. South Miami, High Pines and parts of Glenvar Heights and Coral Gables see increases.
If your home is moving into a high-risk zone, buying or renewing a policy within 12 months of the change can qualify it for FEMA's newly mapped pricing, which starts lower and phases up. If your home is moving out, nothing changes until February, and your lender may still require coverage afterward. Most of those homes move into shaded Zone X, which is still moderate risk.
How to Check a Specific House
- Look up the address on Miami-Dade County's flood zone map, or call the county Flood Zone Hotline at 305-372-6466. Until Feb 19, 2027, ask for the zone on both the current and the new map.
- Find the elevation certificate. Miami-Dade has a search for homes built after 1995, and city building departments keep their own. For an older house, ask the seller or hire a surveyor.
- Read the seller's flood disclosure.
- Get an actual flood quote, NFIP and private, during your inspection period.
Send me the address and I will pull the flood zone on both maps and the elevation certificate, if one is on file, so you know where the house stands before you write an offer. Call or text me at 786-223-1117.
Sources
FEMA, OpenFEMA NFIP Redacted Policies v3 and NFIP Redacted Claims v3, data as of Sep 8, 2026 (link)
FEMA, National Flood Hazard Layer and Pending National Flood Hazard Layer (effective Feb 19, 2027), accessed Oct 12, 2026 (link)
FEMA, NFIP Community Status Book (effective map dates and Community Rating System classes)
FEMA FloodSmart, flood zones, premium costs, buying a policy and the newly mapped discount (link) (link) (link)
42 U.S.C. 4012a (purchase requirement) and 4015(e) (annual increase limits)
44 CFR 59.1 (substantial improvement)
Citizens Property Insurance, flood insurance requirement
Florida Statutes 689.302 (flood disclosure): and 627.715 (private flood insurance) (link)
Miami-Dade County Property Appraiser parcel layer, Flood Zone Maps and Elevation Certificates (link)
U.S. Census Bureau, TIGERweb 2010 and 2020 census block groups (used to match FEMA records to neighborhoods)
National Hurricane Center reports: Andrew (), Katrina (), Alex / PTC One () (link) (link)
National Weather Service Miami: Irene 1999 (), October 2000 flood (), Irma 2017 () (link) (link)
City of Miami, King Tides