Miami-Dade Property Tax Rates by Neighborhood: 2025-26 Combined Millage Guide
Updated May 23, 2026. Reflects 2025-26 final adopted millage rates verified against each jurisdiction's adopted budget.
The pillar piece I published earlier this month covered the framework: homestead, Save Our Homes, portability, the rules that decide how much of your home's value the county can tax. It deferred one variable. The millage rate, the multiplier that turns taxable value into a tax bill, varies by jurisdiction. This is the follow-up.
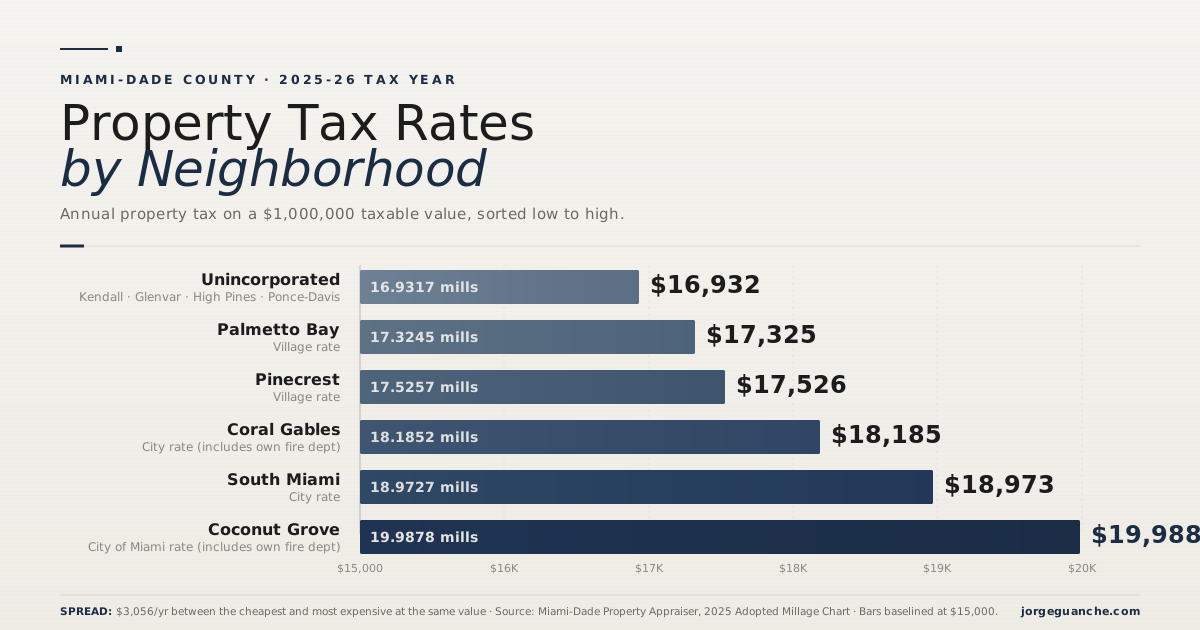
The 8 neighborhoods I cover in southwest Miami-Dade run from a combined 16.9317 mills (unincorporated areas including Kendall, Glenvar Heights, High Pines, and Ponce-Davis) up to 19.9878 mills (Coconut Grove, which pays the City of Miami rate). The spread is 3.0561 mills, or $3,056 a year on a $1,000,000 taxable value. Over a 10-year hold, $30,560. Millage is the single biggest swing variable in a cost-of-ownership comparison across these neighborhoods. Most buyers fixate on price per square foot. The tax bill is where the long-term math compounds.
What Is a Millage Rate?
A mill is one dollar of tax for every $1,000 of taxable value. A 17.32 mill rate equals $17.32 per $1,000, or 1.73%. The formula is the same one the pillar piece used:
Annual Tax = Taxable Value × Millage Rate ÷ 1,000
Take an example. A Palmetto Bay home with $750,000 in taxable value generates $750,000 × 17.3245 ÷ 1,000 = $12,993 in annual property tax. Move that same home to Coconut Grove and the math becomes $750,000 × 19.9878 ÷ 1,000 = $14,991. The home is identical. The bill differs by $1,998 per year because of jurisdiction.
What Goes Into a Combined Millage Rate?
The single combined number on your TRIM notice is a stack of 13 or 14 separate taxing authority levies, depending on where you live. The stack matters because most of the variation between neighborhoods comes from just two of the lines.
Countywide levies (everyone in Miami-Dade pays these regardless of city).
- Miami-Dade County operating: 4.5740 mills
- County debt service: 0.4171 mills
- Library District: 0.2812 mills
- Children's Trust: 0.4638 mills
Total countywide: 5.7361 mills. Same for everyone in all 8 areas here. (A handful of Miami-Dade municipalities have opted out of the Library District; none of the 8 areas in this article are among them.)
School District levies (everyone in Miami-Dade pays these).
- School operating: 5.4990 mills
- School voted: 1.0000 mills
Total school: 6.4990 mills on every Miami-Dade property tax bill. The Miami-Dade School Board reports its total adopted millage at 6.633, which includes a Capital Outlay component the Property Appraiser rolls into the operating line for billing.
Regional levies (everyone pays).
- South Florida Water Management District: 0.1340 mills
- Everglades restoration: 0.0948 mills
- Okeechobee Basin: 0.0327 mills
- Florida Inland Navigation District: 0.0270 mills
- SFWMD debt service: 0.1026 mills
Total regional: 0.39 mills. Same across the county.
County Fire & Rescue: 2.3965 mills. Paid by Palmetto Bay, Pinecrest, South Miami, and all unincorporated areas. NOT paid by Coral Gables or City of Miami, which fund fire through their city budgets. This is one of the two biggest reasons combined rates vary.
City or UMSA municipal levy. The other big swing variable. Ranges from 1.9090 mills (unincorporated UMSA) up to 7.1080 mills (City of Miami operating) plus 0.2536 mills City of Miami debt. In Coral Gables and City of Miami the city portion includes fire; everywhere else it does not. Apples-to-apples comparison requires subtracting fire from those two before comparing.
Run the math. Everyone in these 8 areas pays 12.63 mills baseline (countywide + school + regional). The remaining 4.31 to 7.36 mills of variation comes from two lines: whether the area pays county fire, and what the city or UMSA charges.
What Are the Property Tax Rates in Each Southwest Miami-Dade Neighborhood?
Four of the eight areas I cover (Kendall, Glenvar Heights, High Pines, and Ponce-Davis) all sit inside Miami-Dade's unincorporated municipal services area and share a single combined rate. Coconut Grove sits inside the City of Miami boundary and pays the full City of Miami rate. That collapses the 8 geographies into 6 distinct rate buckets, sorted low to high below.
Unincorporated Miami-Dade: 16.9317 Mills
UMSA portion: 1.9090. Applies to 4 of my 8 coverage areas: Kendall, Glenvar Heights, High Pines, and Ponce-Davis. Geographically distinct, jurisdictionally identical for tax purposes.
On an $800,000 taxable value, a home in any of these four generates $800,000 × 16.9317 ÷ 1,000 = $13,545 in annual tax.
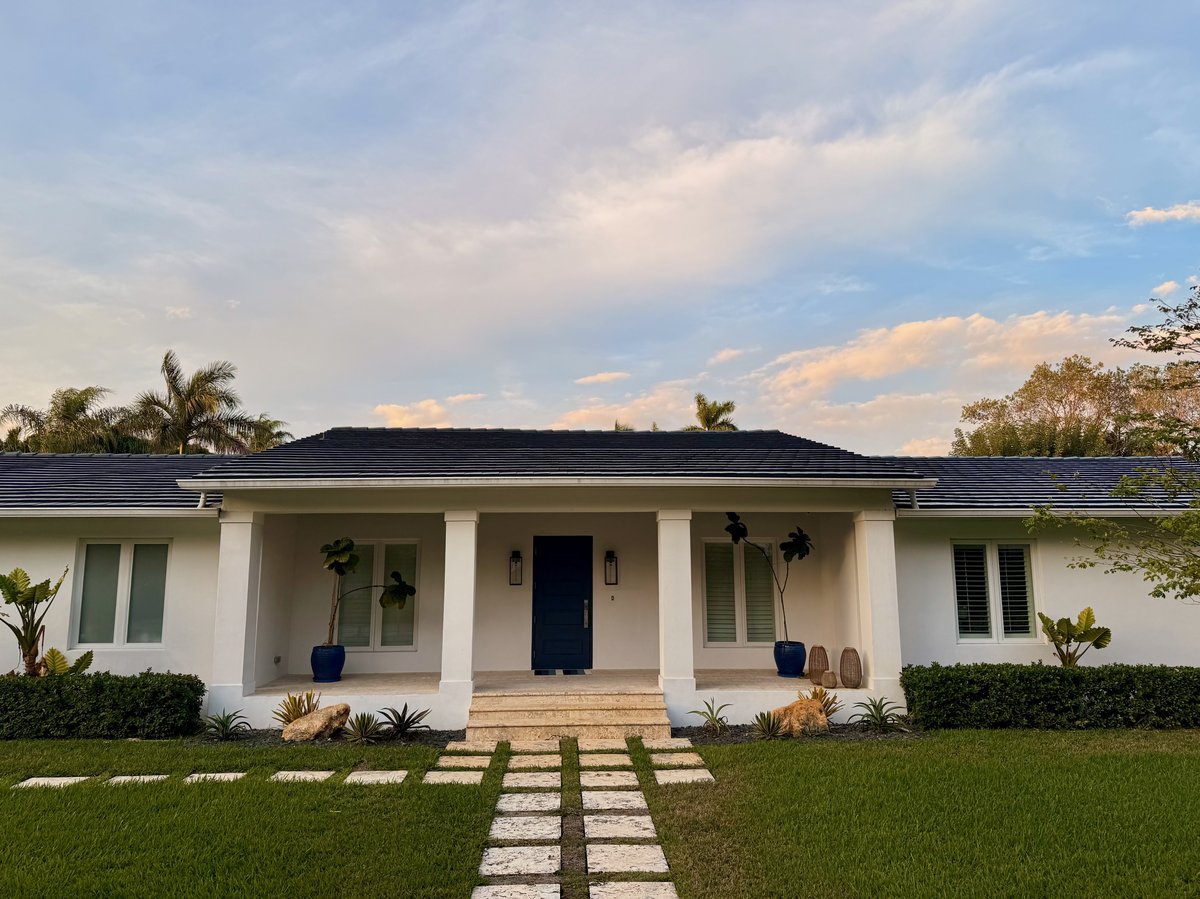
The lower rate comes with trade-offs. No municipal building department, no village hall, no separate code enforcement. County services handle police (MDPD), fire (Miami-Dade Fire Rescue), parks, and code. For buyers who value lighter regulatory touch and a lower carrying cost, this is the cheapest combined rate in the county outside of a handful of small island municipalities.
Palmetto Bay: 17.3245 Mills
Village portion: 2.3018, which the village adopted in September 2025 at 4.50% above its rollback rate (verified in the Sep 15, 2025 Second Budget Hearing agenda).
Run the math on a $1,000,000 taxable value: $1,000,000 × 17.3245 ÷ 1,000 = $17,325 in annual tax.
Incorporated in 2002. Residents pay 0.39 mills more than unincorporated for municipal control over zoning, parks, and code. That works out to around $390 per year per $1M taxable. For most Palmetto Bay buyers, that is the cost of having a village commission accountable to them on land-use decisions, rather than dealing with the county directly.
Pinecrest: 17.5257 Mills
Village portion: 2.5030, the only rate in this set that rose year over year (more on that in Pattern 3 below).
On $1,500,000 in taxable value, a Pinecrest home generates $1,500,000 × 17.5257 ÷ 1,000 = $26,289 in annual tax.
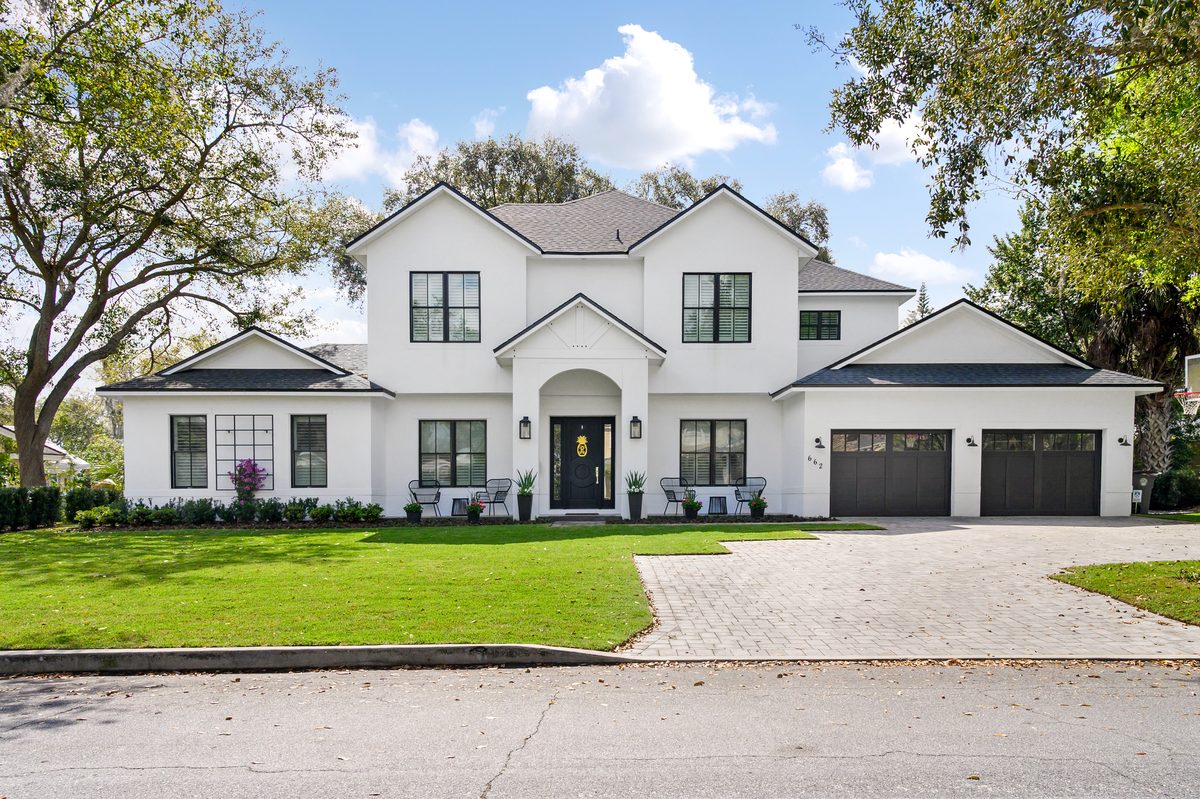
The village has the most concentrated A-rated school footprint in the county and one of the most-funded municipal park systems for its population. The 2.5 mill village portion is the price of that infrastructure.
Coral Gables: 18.1852 Mills
City portion: 5.5590. The Coral Gables City Commission held the city's millage rate flat for the 12th consecutive year in September 2025 (confirmed in the city's FY 2025-26 Adopted Budget and reported by the Coral Gables Gazette).
Take a Coral Gables home with $1,400,000 in taxable value: $1,400,000 × 18.1852 ÷ 1,000 = $25,459 in annual tax.
Important caveat on the city portion. Coral Gables runs its own fire and EMS department, so the 5.559 city millage funds fire service inside the city. Everywhere else in this list (except Coconut Grove) pays a separate 2.3965 county fire millage on top of the city or UMSA rate. Apples-to-apples, Coral Gables city services net of fire run 3.16 mills, which is in the same range as Pinecrest and Palmetto Bay. The headline city number looks high because it absorbs a line item other cities itemize separately.
South Miami: 18.9727 Mills
City portion: 3.9500, confirmed in the City Manager's FY 2026 Budget Message dated July 18, 2025.
A South Miami home with $750,000 in taxable value generates $750,000 × 18.9727 ÷ 1,000 = $14,230 in annual tax.
Small footprint, dense services, walkable downtown corridor along Sunset Drive. The 3.95 mill city portion funds the most service-per-square-mile of any city in this list. Residents trade 1.6 mills above the unincorporated rate (about $1,600 per year on $1M taxable) for that density of city presence.
Coconut Grove (City of Miami Rate): 19.9878 Mills
City portion: 7.1080 operating + 0.2536 debt = 7.3616 city total. Confirmed in the City of Miami FY 2025-26 Adopted Budget in Brief.
On a $1,200,000 taxable value, a Coconut Grove home generates $1,200,000 × 19.9878 ÷ 1,000 = $23,985 in annual tax.
Same fire caveat as Coral Gables. City of Miami runs its own fire and EMS, so the 7.11 mill city operating millage includes fire service. Net of fire, City of Miami operating runs around 4.71 mills, still the highest city operating portion in this list. The city funds a much larger urban service load than any of the southern municipalities, and the millage reflects that.
Three Patterns Most Buyers Miss
The headline combined rate hides three things worth knowing before you run a cost-of-ownership comparison across these neighborhoods.
Pattern 1: The city portions are closer than they look once you net out fire. Coral Gables city millage looks like 5.56 mills against Palmetto Bay's 2.30 mills, more than double. But Coral Gables includes its own fire service in that 5.56. Subtract the 2.3965 county fire millage other areas pay separately and Coral Gables city services run 3.16 mills. Same exercise on City of Miami operating: 7.11 minus 2.40 equals 4.71 mills (the separate 0.25 mill city debt service stays on top). The municipal-services gap across these six areas is narrower than the headline city numbers suggest.
Pattern 2: The county headline rate has been flat for years, but the dollar bill has not. The countywide operating millage of 4.5740 has not moved meaningfully in recent cycles. The county press release for the FY 2025-26 adoption frames this as "the lowest combined tax rate since 1982." That is technically accurate. But over the same span, taxable values have run up substantially, so the actual dollar bill has risen even with flat millage. The bill is millage times value. Both move, and value has been doing most of the moving.
Pattern 3: Pinecrest is the one area that went up. Every other rate above is flat or down slightly year over year. Pinecrest's combined rate rose 0.1360 mills from 2024, or $136 per year more on $1M taxable. The village originally adopted a tentative rate of 3.86 in July 2025 and brought it down to 2.5030 in September after resident pushback. The final number is the compromise. Worth knowing if you are pricing a Pinecrest purchase.
How This Should Factor Into a Purchase Decision
Three angles I work through with buyers when millage matters to the choice.
Side-by-side carrying cost across neighborhoods. When a buyer is choosing between two areas at similar price points, the millage delta translates directly into annual carrying cost. Pinecrest versus Palmetto Bay at $1,500,000 taxable is $26,289 versus $25,987, a $302 per year spread that probably will not change anyone's mind. Coconut Grove versus Glenvar Heights at the same taxable value is $29,982 versus $25,398, a $4,584 per year spread that does. It changes the affordability math for the same home.
Resale comp and rental math. Higher-millage areas have to deliver service value buyers and tenants will pay for, otherwise the carrying cost erodes the appeal. Coral Gables clears that bar easily on schools, code enforcement, and infrastructure. Coconut Grove pays the same City of Miami rate as the rest of the city, which is a flat rate by design; what each neighborhood gets back in services varies. For investment property analysis, the millage delta hits NOI directly. Cap rate math on a Coconut Grove rental looks different from cap rate math on a Kendall rental at the same gross income, primarily because of this line item.
The combined picture (millage plus taxable value plus exemptions). Millage is one variable. The other two are taxable value (set by the Property Appraiser, with the Save Our Homes cap controlling year-over-year growth for homesteaded properties) and the homestead exemption itself, which knocks $51,411 off taxable value for any qualifying primary residence in 2026. For the full mechanics on how those three variables interact, the pillar piece is the reference. This article isolates the millage piece. Both numbers matter.
What Changes in September 2026
Every Miami-Dade jurisdiction adopts its next year's millage rate in September, effective October 1 and reflected on the November tax bill. The FY 2026-27 cycle gets set on that timeline.
Any reform that affects school millage (the largest single bucket at 6.4990 mills) shows up here too. See the pillar piece for the current state of the 2026 Florida legislative reform push (HJR 211, HJR 203, and the special session activity). This article gets updated after September with the FY 2026-27 numbers as each jurisdiction adopts them.
If you are buying or selling in southwest Miami-Dade in the next 90 days and want the per-property millage math run cleanly before you commit, I do this for every client. Reach me at 786-223-1117 or jorge.guanche@compass.com.
Sources
Miami-Dade Property Appraiser, 2025 Adopted Millage Rates Chart
Miami-Dade County, FY 2025-26 Adopted Budget Revenues
City of Miami, FY 2025-26 Adopted Budget in Brief
City of Coral Gables, FY 2025-26 Adopted Budget
City of South Miami FY 2026 Budget Message (City Manager Iglesias, July 18, 2025)
Village of Pinecrest FY 2026 adopted budget release
Village of Palmetto Bay Second Budget Hearing Agenda, September 15, 2025
Miami-Dade County Public Schools, FY 2025-26 Adopted Budget release
Companion article: Property Taxes, Homestead, and Portability in Miami-Dade