Q3 2026 Market Report: Single-Family Homes Across the 8 Neighborhoods I Cover
This report covers Coral Gables, Coconut Grove, Pinecrest, Glenvar Heights, South Miami, Palmetto Bay, Kendall, and High Pines + Ponce-Davis, comparing July through September 2026 with the same months of 2025.
Single-family homes | 8 southwest Miami-Dade neighborhoods | Q3 2026 | Source: SE FL MLS, polygon-classified
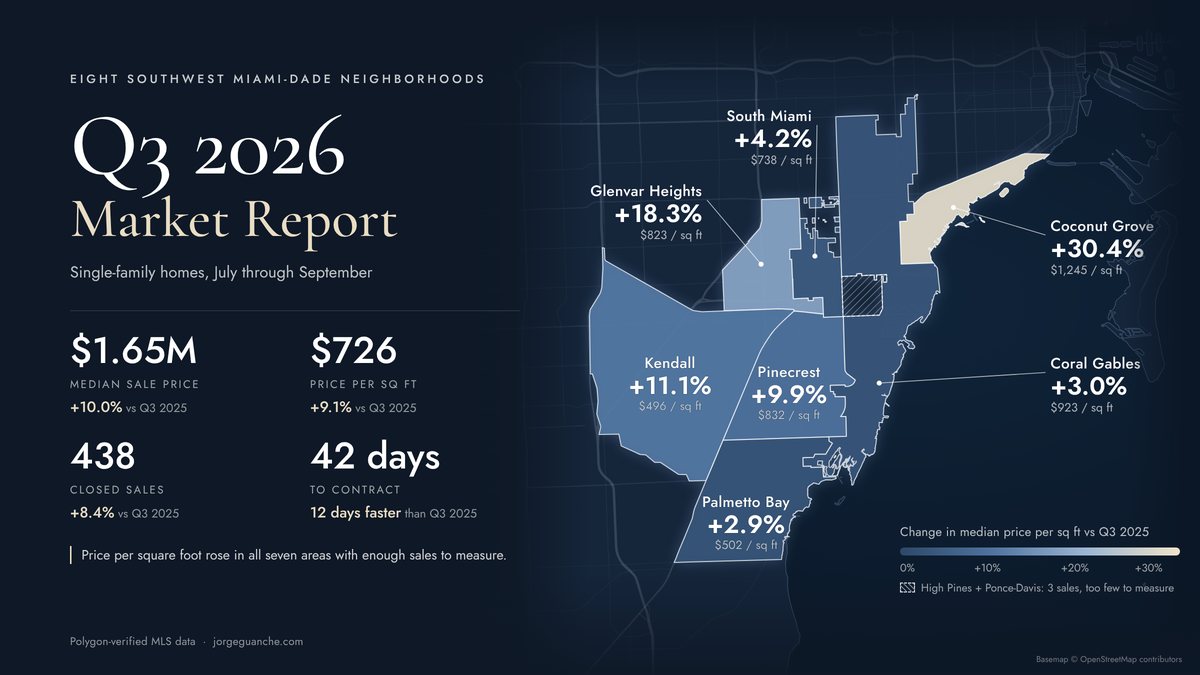
The median single-family sale price across the eight neighborhoods I cover was $1,650,000 in the third quarter, up 10.0% from a year earlier, on 438 closings. Homes went under contract 12 days faster, and price per square foot climbed in all seven areas with enough sales to measure.
The fourth quarter starts on softer footing for sellers. Mortgage rates crossed 7% in late September, and supply rose to 4.2 months from about 3.9 in early July because fewer homes closed this quarter, even though fewer were listed. Months of supply is how long today's listings would take to sell at the recent pace, and the shorter it is, the stronger the seller's hand.
All figures are medians for single-family homes across the eight neighborhoods. Days to contract runs from listing to accepted contract.
Mortgage rates and the countywide market
Rates moved the wrong way for buyers. Freddie Mac's 30-year average was 6.43% on July 2 and 7.28% on October 1, against 6.34% a year earlier. On a $1 million loan, that move adds about $570 a month in principal and interest. Nearly all of the homes in this report went under contract before September, so these closings reflect summer pricing at mid-6% rates.
Countywide, MIAMI Realtors' August 2026 release put the Miami-Dade single-family median at $680,000, up 3.8% from a year earlier, with a 40-day median time to contract and 4.9 months of supply. Against that snapshot, the eight neighborhoods here gained more on price (10.0% against 3.8%) and had less supply (4.2 months against 4.9), though homes took two days longer to reach a contract.
Which price ranges grew
More of the quarter's sales came from higher price ranges. Closings between $2 million and $3 million rose from 58 to 90, while sales under $1 million fell from 95 to 72, and sales at $1 million and up rose from 309 to 366. Total sales volume reached $1.10 billion, up 10.3%, only a little faster than the 8.4% rise in closings, so the average sale rose 1.8% while the median rose 10.0%. The gain came between $1 million and $3 million, where closings rose from 223 to 273, while sales of $10 million and up went from 9 to 10.
That matters for every number below. When the mix moves up, the median rises even if no individual house gained value, so I read the median next to price per square foot, which adjusts for size.
Neighborhood breakdown
Every sale below is placed by where it sits on the map, whatever neighborhood the listing named (how that works), and each figure is compared with the same quarter a year earlier.
Tap or hover over an area for its numbers and a link to the neighborhood guide. Boundaries match the maps on each guide. Basemap © OpenStreetMap contributors.
| Neighborhood | Median Sold | YoY | $/SF | YoY | Days to Contract | Closed | YoY |
|---|---|---|---|---|---|---|---|
| Pinecrest | $2,900,000 | +14.4% | $832 | +9.9% | 43 | 63 | 0.0% |
| Coconut Grove | $2,800,000 | +21.7% | $1,245 | +30.4% | 45 | 57 | +54.1% |
| Coral Gables | $2,102,500 | +12.1% | $923 | +3.0% | 40 | 96 | +1.1% |
| Glenvar Heights | $1,810,000 | +4.6% | $823 | +18.3% | 40 | 17 | -15.0% |
| South Miami | $1,391,500 | +10.9% | $738 | +4.2% | 43 | 22 | +22.2% |
| Kendall | $1,200,000 | +13.5% | $496 | +11.1% | 41.5 | 93 | +13.4% |
| Palmetto Bay | $1,200,000 | +9.4% | $502 | +2.9% | 41 | 87 | +11.5% |
| High Pines + Ponce-Davis | n/m | n/m | n/m | 3 | -72.7% | ||
| All eight neighborhoods | $1,650,000 | +10.0% | $726 | +9.1% | 42 | 438 | +8.4% |
n/m = not meaningful (3 sales). The summary statistics in this table are published under CC BY 4.0. Quote or reuse them with credit to Jorge Guanche and a link to this report. The underlying MLS records are not redistributed.
The two price measures can tell different stories. In Coral Gables the median rose 12.1% while price per square foot rose 3.0%. Glenvar Heights went the other way, with the median up 4.6% and price per square foot up 18.3%, and the typical home sold there this quarter was about 700 square feet smaller than a year earlier, which pushes the per-foot figure up. When the two disagree, I price from comparable sales and use neither median on its own.
Coconut Grove: the quarter's biggest move
Coconut Grove closed 57 sales against 37 a year earlier, at a $2,800,000 median, up 21.7%. Price per square foot rose 30.4% to $1,245, the highest of the eight areas. Eight of those sales were new construction, against three a year earlier, and the top sale closed at $22.5 million, so more new, high-end homes were in the mix. The medians cannot separate that from appreciation, which is why I price an older Grove house from recent sales in its own part of the Grove.
Kendall: double-digit gains on a large sample
Kendall closed 93 sales, up from 82, at a $1,200,000 median, 13.5% above last year, with price per square foot up 11.1% to $496. The median home went under contract in 41.5 days, faster than the 49.5 days of a year ago, though slower than the 25 days of the second quarter. At 3.3 months of supply, Kendall still favors sellers.
Pinecrest: twice as fast to contract
Pinecrest's median home went under contract in 43 days, against 92 a year earlier, and supply tightened from 7.4 months in early July to 5.4 as of October 4. The median sale was $2,900,000, up 14.4%, on 63 closings, the same count as last year. Pinecrest still has the most supply of the seven measurable areas, with 113 active listings at a $5.8 million median asking price, so buyers there have the widest choice.
Small samples. South Miami (22 sales) and Glenvar Heights (17) move with whichever homes happened to close, so read their changes as a direction. Glenvar's 18.3% per-foot gain came with only one new-construction sale, against five a year earlier. High Pines + Ponce-Davis recorded 3 sales, too few to compare; over the trailing twelve months, High Pines had a $3,200,000 median on 21 sales and Ponce-Davis $8,075,000 on 24.
Inventory and asking prices
As of October 4 there were 615 active single-family listings and 202 under contract across the eight neighborhoods, or 4.2 months of supply at the third quarter's pace. I read under four months as a seller's market, four to six as balanced and over six as a buyer's market. Half of the active listings had been on the market more than 90 days, but the homes that did sell gave up little on price. The median sold for 94.9% of its final asking price, meaning the price after any reductions, and every area with enough sales landed between 93.9% (Coconut Grove) and 97.4% (Glenvar Heights).
Active listings and closed sales are different houses, so the gap shows where inventory is priced, not how much any seller will accept. What buyers negotiated shows in the 94.9% figure above.
What I'm telling my clients right now
Buyers: Rates are above 7%, so get a fresh pre-approval before you make an offer, and expect a well-priced home to sell within about 5% of its final asking price.
Sellers: Price to the recent sales instead of the listings around you. The homes that sold went under contract in a median 42 days, while half of today's inventory has been waiting more than 90.
Investors: Palmetto Bay (2.8 months of supply) and Kendall (3.3) are the tightest resale markets of the eight, which matters most if you may need to sell within a few years.
The bottom line
The third quarter's closings favored sellers, with higher prices, faster contracts and more sales at $1 million and up than a year earlier. The inventory heading into the fourth quarter is closer to balanced, at 4.2 months of supply, and rates are above 7%. The number I am watching is homes under contract, which fell to 202 on October 4 from 216 on July 5. If that keeps sliding while supply rises, buyers will gain leverage as the fourth quarter goes on.
Sources
SE Florida MLS via Compass Property Analysis exports, pulled October 4, 2026: single-family closings Q3 2026 and Q3 2025, active and under-contract listings as of October 4, 2026
Freddie Mac Primary Mortgage Market Survey, July 2 and October 1, 2026, and October 2, 2025
Miami Association of Realtors®, Miami-Dade County single-family homes, August 2026 statistics, released September 16, 2026
Early-July supply and under-contract counts: the July 5, 2026 snapshot published with the Q2 2026 report and the neighborhood guides
Data note: single-family homes only, each classified by its mapped location. Lots, boat slips, condos, townhomes, duplicate records and sales under $300,000 are excluded. Public-record sales can be recorded after the data pull, so third-quarter counts may rise slightly.