Q2 2026 Market Report: Single-Family Homes Across the 8 Neighborhoods I Cover
Closed sales, pricing, and supply for Coral Gables, Coconut Grove, Pinecrest, Glenvar Heights, High Pines + Ponce-Davis, South Miami, Palmetto Bay, and Kendall.
Single-family homes | 8 southwest Miami-Dade neighborhoods | Q2 2026 | Source: SE FL MLS, polygon-classified
A newer report is available: Q3 2026 Southwest Miami-Dade Market Report.
The spring market delivered. Across the eight neighborhoods I track, single-family closings reached $1.53 billion in Q2 2026, up 39.4% from the same quarter last year, and Miami-Dade single-family sales have now risen nine consecutive months. Price per square foot climbed in seven of the eight areas, and supply in most of them sits well below the county average.
The macro picture
Mortgage rates are cooperating without collapsing. The 30-year fixed averaged 6.43% as of July 2, down from 6.67% a year ago, according to Freddie Mac. Fannie Mae's June forecast holds rates near 6.4% through 2026, and the MBA sees 6.5%, so nobody serious is predicting cheap money. The bigger local shift is insurance: Citizens' approved 2026 rates cut Miami-Dade HO-3 premiums by an average of 14.0%, part of its first average personal-lines decrease since 2015, effective July 1 for new policies and at renewal for existing ones, and private carriers including Florida Peninsula and Security First have filed decreases of their own. I broke down what the cuts mean and how to lower your own premium separately. For the first time in years, the carrying-cost conversation is moving in the buyer's favor.
Neighborhood breakdown
County-wide, single-family supply stood at 5.2 months in May 2026 per the latest MIAMI Realtors release, balanced territory and tighter than the 6.4 months I reported in the Q1 2026 update. Most of the areas below run tighter still.
All figures are single-family only, Q2 2026 vs Q2 2025, classified by each property's actual location rather than its MLS label.
| Neighborhood | Median Sold | YoY | $/SF | YoY | DOM | Closed Sales | YoY |
|---|---|---|---|---|---|---|---|
| Glenvar Heights | $2,394,990 | +50.6%* | $743 | +11.4% | 107 | 27 | +12.5% |
| Coconut Grove | $2,750,000 | +2.8% | $1,105 | +17.0% | 37 | 68 | +25.9% |
| Coral Gables | $2,550,000 | +10.3% | $957 | +1.3% | 44 | 133 | +7.3% |
| Pinecrest | $2,560,000 | +21.9% | $729 | -1.9% | 62.5 | 51 | -3.8% |
| High Pines + Ponce-Davis | $7,250,000 | see note | $1,255 | +16.4% | 59 | 15 | +50.0% |
| South Miami | $1,020,000 | -7.3% | $655 | +0.8% | 49 | 32 | -11.1% |
| Palmetto Bay | $1,200,000 | +1.5% | $508 | +8.2% | 50.5 | 93 | +10.7% |
| Kendall | $1,092,500 | +19.4% | $494 | +1.1% | 25 | 88 | -16.2% |
*Glenvar median lifted by six new-construction closings; see below. High Pines + Ponce-Davis closed 15 sales against 10 last year, too few for a meaningful median comparison.
The summary statistics in this table are published under CC BY 4.0. Quote or reuse them with credit to Jorge Guanche and a link to this report. The underlying MLS records are not redistributed.
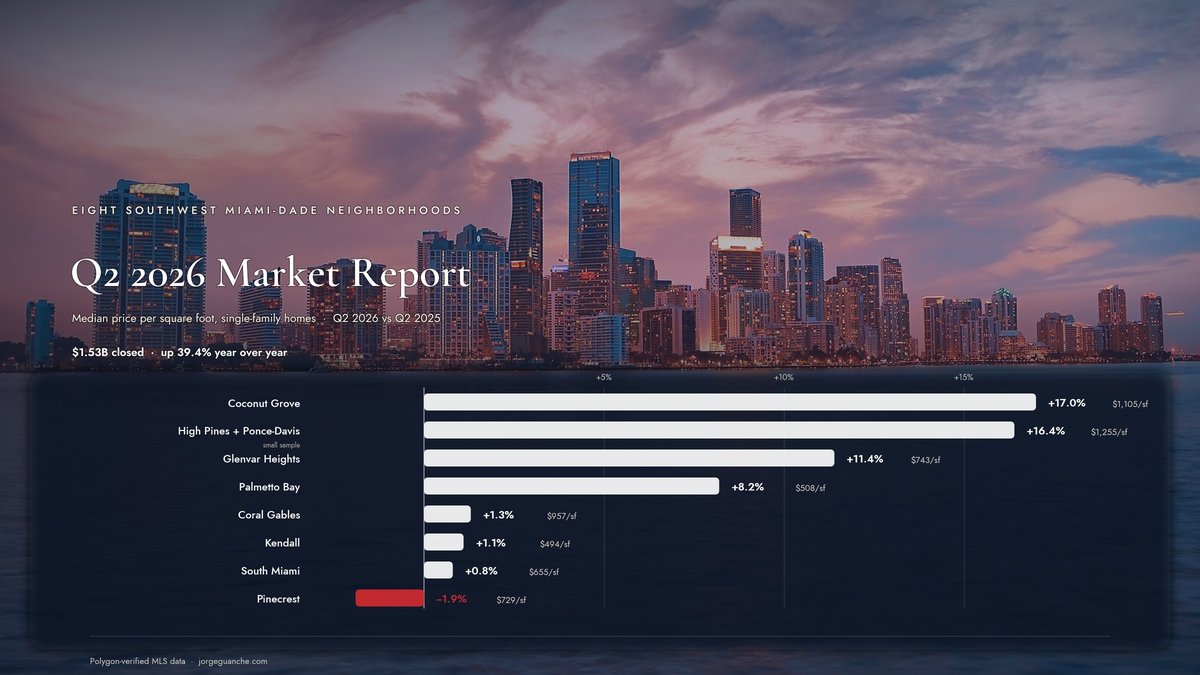
$/SF change by neighborhood, Q2 2026 vs Q2 2025
Median price per square foot, single-family closings, year over year. A second read alongside the median rather than a correction of it: the mix of homes sold, location, condition and land all move it.
† High Pines + Ponce-Davis: 15 sales this quarter; small-sample figure. Source: polygon-classified SE Florida MLS data, Apr 1 - Jun 30, 2026 and 2025.
Glenvar Heights is the quarter's quiet standout. Twenty-seven closings, up 12.5% year over year, at $743 per square foot, up 11.4%. Six of those closings were new construction between $2,394,990 and $5,553,146, a product tier that barely existed here a year ago, and it pulled the median to $2,394,990. Homes that closed did take longer to find their buyer than last year (107-day median against 29), so I would call this durable demand rather than a frenzy. The supply side is what stands out: just 20 homes on the market, 9 more under contract, and 2.2 months of supply, the tightest inventory of all eight areas. The land market backs this up. At $743 per square foot and rising, against the tightest inventory of the eight areas, an older house on a good Glenvar lot is increasingly priced off what the lot could support rather than off the house standing on it. That is the shift worth watching here.
Neighborhood Spotlight
Glenvar Heights, Q2 2026
Median includes new construction in both years. Snapshot of active and under-contract listings as of July 5, 2026.
Coconut Grove posted the cleanest appreciation in the report. Median price per square foot rose 17.0% to $1,105 on 68 closings, up 25.9%, with a 37-day median DOM. Unlike the bigger median swings elsewhere in the table, this number carries less mix noise, though no single quarter settles it. My read is that the Grove repriced.
Kendall remains the fastest market I cover. A 25-day median DOM, down from 38 last year, with 44 homes under contract against 105 active listings. Pricing held steady at $494 per square foot, which tells me the speed comes from real demand meeting realistic asking prices.
Months of supply by neighborhood, July 2026
Active listings divided by the quarter's monthly sales pace. Lower means tighter. Under 4 months favors sellers; above 6 favors buyers.
Active counts as of July 5, 2026, excluding coming-soon and off-market listings. Navy bars run tighter than the county's 5.2-month reference (MIAMI Realtors, May 2026).
Pinecrest is the honest counterweight. The median sold price jumped 21.9% while per-square-foot pricing slipped 1.9%, supply stands at 7.4 months, and sellers accepted a median 92.7% of asking, the lowest ratio of the eight. It is the one area in this report where buyers hold the leverage.
What I'm telling my clients right now
Buyers: Below $2 million in Kendall, Palmetto Bay, and South Miami you are competing against 3.3 to 3.6 months of supply, so get pre-approved before you tour and be ready to offer inside a week. If you want negotiating room, it lives in Pinecrest and the estate tier.
Sellers: Closed sales ran at roughly 95% of final asking across these neighborhoods. Price to the last 90 days of comps and you will clear; price to your neighbor's 2025 fantasy and you will sit next to Pinecrest's 126 active listings.
Investors: The Citizens cut plus falling private premiums just improved every hold calculation in the county. In Glenvar Heights, the gap between what an older house on a good lot trades for and what finished new construction clears is now wide enough that rebuild economics are setting the price; that spread is the math worth studying.
What Q2 adds up to
Q2 2026 was a luxury-led, supply-constrained quarter: dollar volume up 39.4% across my eight core areas on only 3.5% more closings, with per-foot pricing up nearly everywhere. Watch two things into Q3: the June county numbers, and whether Glenvar Heights' new-construction tier keeps printing at $5 million. If you are weighing a move in any of these neighborhoods, call me at 786.223.1117 and we will run the numbers for your specific block.
Sources
Miami Association of Realtors®, May 2026 statistics, released June 16, 2026
SE Florida MLS via Compass Property Analysis exports, pulled July 5, 2026
Freddie Mac Primary Mortgage Market Survey, July 2, 2026
Fannie Mae Housing Forecast, June 2026
MBA Mortgage Finance Forecast, May 2026
Citizens Property Insurance Corporation, Revised 2026 Rate Kit, approved rates effective July 1, 2026
Miami-Dade County public records via Homes.com ownership history (Glenvar land re-sale, March 2025 to April 2026)